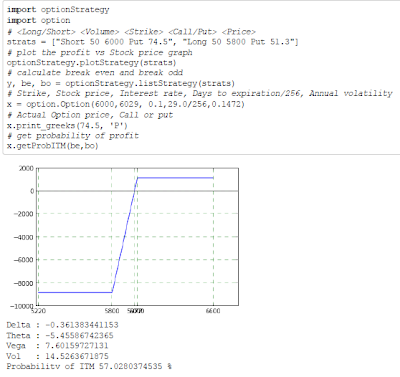
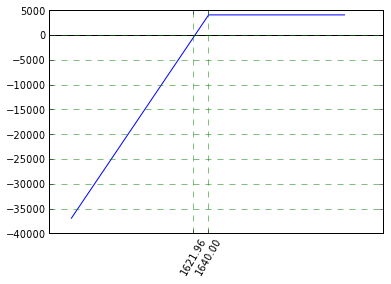
This code snippet displays the profit vs underlying diagram for a combination of option strategies. The chart shows the amount of profit earned for the price movement at expiration and also the break even price.
Before we jump into the code, let us look at the python notebook example.
As we can see all the inputs need is the strategy themselves. We can also see that break even is at 107.33.
The strategies are defined are strictly typed. For Stock the syntax is as follows.
<Long/Short> <Volume> Stock <Price>
and for option...
<Long/Short> <Volume> <Strike> <Call/Put> <Price>
The graph is plotted using matplotlib's pyplot. This is the only externally used library.
import matplotlib.pyplot as plt
Next we need floating point version of range, and the best implementation happens to be the following
def drange(start, stop, step):
 r = start
 while r < stop:
  yield r
  r += step
Followed by processStrategy which processes individual strategy and generates profit of loss value for a particular price point. As we can see the the flow is split depending on whether we have Call, Put or Stock and a Long or Short strategy.
def processOptionStrategy(strat, price_point):
 strategy = strat.split(' ')
 if (strategy[2] == 'Stock'):
  volume = float(strategy[1])
  price = float(strategy[3])
 else:
            try:
                volume = float(strategy[1])
                strike = float(strategy[2])
                price = float(strategy[4])
            except:
                print "dumbass...numbers"
 if strategy[0] == 'Long':
  if strategy[3] == 'Call':
   if price_point < strike:
    return -(price * volume)
   else:
    return (((price_point - strike) * volume) -(price * volume))
  elif strategy[3] == 'Put':
   if price_point > strike:
    return -(price * volume)
   else:
    return (((strike - price_point) * volume) -(price * volume))
  elif strategy[2] == 'Stock':
                    return (price_point - price) * volume
  else:
   print "...Call or put"
 elif strategy[0] == 'Short':
  if strategy[3] == 'Call':
   if price_point < strike:
    return (price * volume)
   else:
    return ((price * volume)) - ((price_point - strike) * volume)
  elif strategy[3] == 'Put':
   if price_point > strike:
    return (price * volume)
   else:
    return ((price * volume)) - ((strike - price_point) * volume)
  elif strategy[2] == 'Stock':
                    return (price - price_point) * volume
  else:
   print "...Call or put"
 else:
  print "...Long or short"
and finally we plot a graph for all the possible price points in range. X axis values for all values present in strategies and breakeven points are also added.
def plotStrategy(strats, min1=0.9, max1=1.1):
 stratvals = []
 min = 100000
 max = 0
 xticks = []
 for row in strats:
     valstr = row.split(' ')[2]
     if valstr == 'Stock':
         val = float(row.split(' ')[3])
         xticks.append(val)
     else:
         val = float(valstr)
            if val < min:
                min = val
            if val > max:
             max = val
            stratvals.append(val)
            xticks.append(val)
 yvals = []
 xvals = []
 max = max * max1
 min = min * min1
 for i in drange(min, max, (max - min) / 200.0 ):
  xvals.append(i)
  sum = 0
  for strat in strats:
   sum = sum + processOptionStrategy(strat, i)
  yvals.append(sum)
  if i in stratvals:
   xticks.append(i)
  if len(yvals) >3:
   if (abs(yvals[-1] + yvals[-2]) < abs(yvals[-1] - yvals[-2])):
    xticks.append(i-(max - min) / 200.0)
 plt.plot(xvals, yvals)
 plt.axhline(0, color='black')
 plt.xticks(xticks)
 plt.setp(plt.xticks()[1], rotation=60)
 plt.grid(b=True, which='major', color='g', linestyle='--')
and that's it. That is all required to plot Option strategies.


